The Recommendation Performance report offers actionable insights into how product recommendations boost revenue and influence customer purchasing behaviour.
By examining this dashboard, you can assess the direct financial impact of your recommendation strategies, monitor the Average Order Value (AOV) lift, and visualize how recommended items contribute to your total Gross Merchandise Value (GMV).
Navigation
To access this report, go to the Greenline dashboard:
Reports > Insights > Recommendation Performance
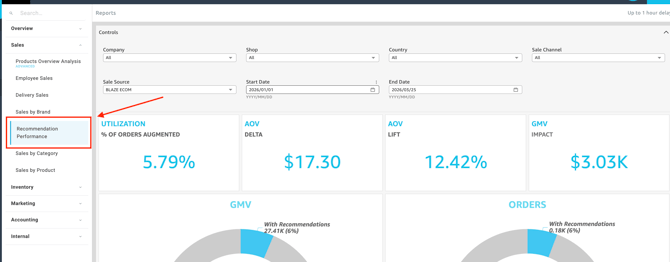
Dashboard Metrics & Reports
The dashboard provides a comprehensive view of your sales through various Key Performance Indicators (KPIs), detailed breakdowns, and visual charts.
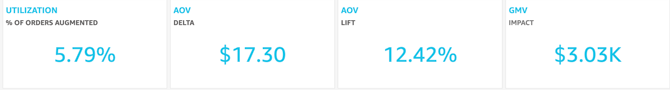
Detailed Breakdowns
-
Utilization:
- The percentage of total orders or customers that interacted with and purchased an item from a recommendation widget.
-
AOV Delta:
- The absolute dollar amount difference in Average Order Value (AOV) between orders that included a recommended item and those that did not.
-
AOV Lift:
- The percentage increase in Average Order Value (AOV) directly attributed to customers purchasing recommended items.
- GMV Impact:
- The total Gross Merchandise Value (GMV) generated specifically from the recommended products during the selected timeframe.
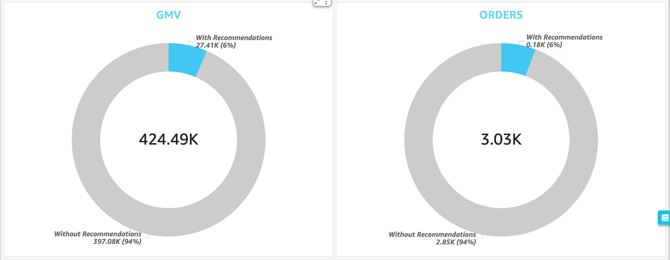
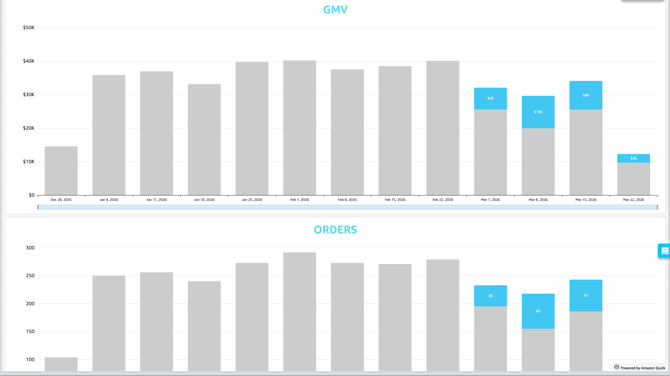
Charts & Visualizations
-
GMV:
- A visual representation of Gross Merchandise Value trends over time, comparing your total sales against the revenue driven specifically by recommendations.
-
Orders:
-
A graphical breakdown of total order volume over your selected date range, highlighting the proportion of orders that contained recommended items.
-
💡 Pro Tip: You can export this or any KPI held in Insights to a CSV or Excel file. Simply click the More Options (three-dot icon) in the upper right-hand corner of the metric.